


Canary Seed Analysis
Technical Analysis of Canadian Special Crops Markets

I grew up and farmed in Western Saskatchewan, near Laporte, an area that has an amazing history of special crops adoption and individuals who have made significant contributions to agriculture.
I will share these stories in the future. I am confident that you will enjoy them.
In the early 1970s, Reinhold Nunweiler, a neighbour and family friend, travelled to Texas, returning with Canary seed bags in the car trunk. Reinhold soon kicked off canary seed production in Saskatchewan, with other neighbours adopting the crop as part of their rotation.
With no Canadian market to sell into, Reinhold and two partners created Allstate Grain, which became a significant exporter of pulses and special crops, providing several individuals with their start in the industry.
For this reason, I have chosen Canary Seed for the inaugural Klarenbach Special Crops Report.
Today, we will look at the weekly Canary Seed at Saskatchewan Plant price charts dating to 1992.
****Click on the images to enlarge****
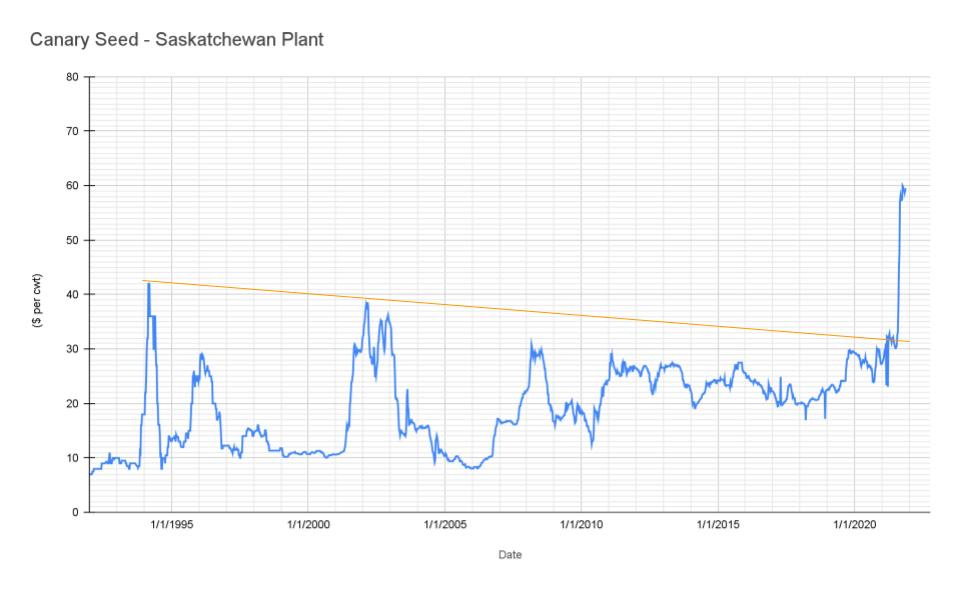
As the first chart demonstrates, the beginning of 2021 broke a long-term trendline connecting the highs of 1994, 2002 and 2020.
The longer a trendline is, the larger the move is anticipated.
The move following the break of this 27-year trend supports that thesis.
The 2021 price action is typical for this chart pattern found in stocks, commodities, forex, etc.
I identified a similar pattern for Canola and Soybeans in my September 7, 2020 issue of the Klarenbach Report, where I suggested that we are entering the Golden Age of Agriculture.
An experienced chart technician would have anticipated significantly higher prices upon break of the trendline in January/February before the drought concerns, aka the News or fundamentals was known.
This newsletter intends to use chart patterns, like this one, to anticipate opportunities for long or short positions ahead of the price movement.
While the chart pattern suggested much higher prices, we do not know how high they will go.
Currently, the price is just shy of the all-time high of $60 per cwt.
The question is, Will the prices go higher or have we topped?
Let’s look at a lower timeframe to see if we find some clues.
The chart below shows the price action of the past three years in greater detail.
****Click on the images to enlarge****
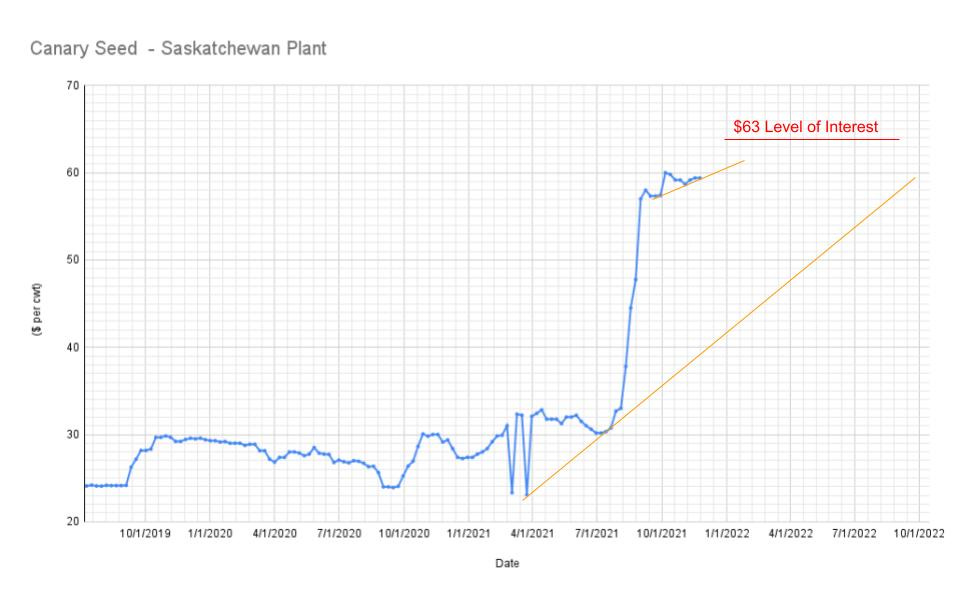
The shorter-term chart shows the price consolidating below the recent high of 60.
I am bullish above 60 and bearish below.
Currently, the price is holding above the upper yellow trendline.
If this trendline breaks, I become more bearish.
A new low below 57 sets up a move down to the previous supply in the 33-34 range.
It could be a fast and furious drop.
A break below 57 signals producers to take partial or full profits.
The lower yellow trendline will be met somewhere north of 40.
Perhaps that trendline will bring in buyers; time will tell.
As a market technician, I rely on Fibonacci retracement and expansion tools to identify levels of interest where the price often slows down or reverses. I have no idea why this happens; however, it does.
I have labelled the first bullish level in red on the chart at 63.
Often a confluence of indicators will add strength to these levels. In the case of my charts, the confluence would be the Fibonacci levels and the trendlines.
Below are my Bullish and Bearish levels of interest
BULLISH LEVELS OF INTEREST
(Take partial or Full Profits)
63
72
88
92
96
BEARISH LEVELS OF INTEREST
(Long entry or possible support level)
48
40
34
28
I hope you enjoy this analysis, and I am interested in any feedback you can provide.
Hi Trent Bill Stevenson was a high profile lawyer and Ron Butterley was a pharmacist in Eston
Sadly both are deceased now
Just a little more inf
Good information Trent the other two partners in Allstate were Bill Stevenson and Ron Butterley great company