

Red Lentils
klarenbachspecialcropsreport.substack.com
Red Lentils
Special Crops Technical Analysis

Today we look at the Red lentil charts.
Readers can find my historical Red lentil analysis here.
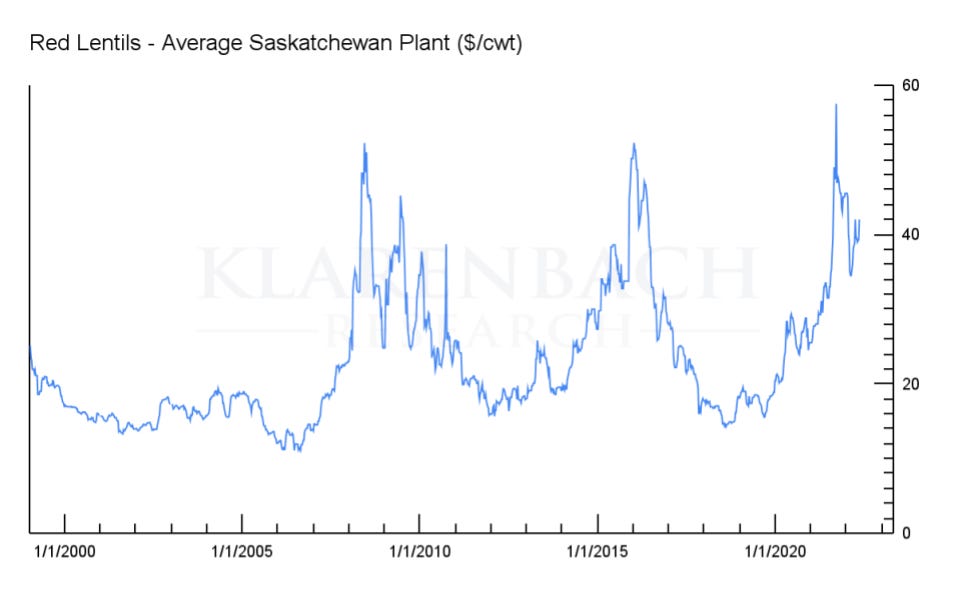
The first chart, dating back to 1999, illustrates the historical volatility of the price.
Drilling down to a short time horizon provided additional clues for price direction.
Keep reading with a 7-day free trial
Subscribe to Klarenbach Special Crops Report to keep reading this post and get 7 days of free access to the full post archives.