

Small Green Lentil Seasonal Highs and Lows
klarenbachspecialcropsreport.substack.com
Small Green Lentil Seasonal Highs and Lows
Removing the Guesswork

This one goes out to the Landshark.
Hopefully, he reads this and decides not to put me in the Dreaded Camel Clutch.

One can hope….
This analysis will follow the format found in yesterday’s newsletter:

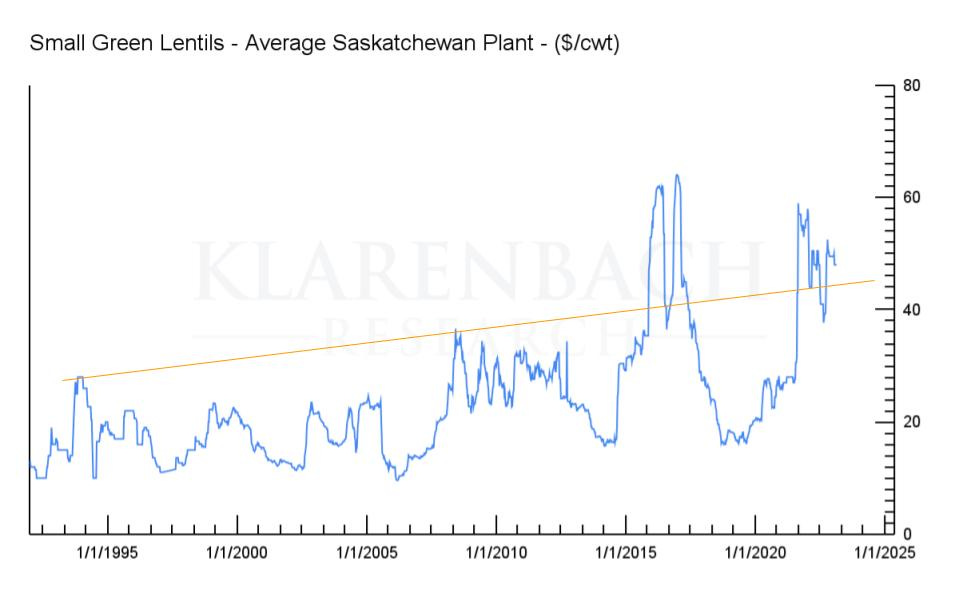
This small green lentil analysis will consider our average Saskatchewan price index for the 1993-2022 crop years. A total of 30 years.
First, the long-term chart.
The table below summarizes which month had the highs and lows for the 30 years of analysis.
Keep reading with a 7-day free trial
Subscribe to Klarenbach Special Crops Report to keep reading this post and get 7 days of free access to the full post archives.