

Yellow Mustard
klarenbachspecialcropsreport.substack.com
Yellow Mustard
Removing the Guesswork

Several of our readers are mustard growers.
A few others are brokers and dealers.
Let’s look at Yellow Mustard charts for clues of future price behaviour.
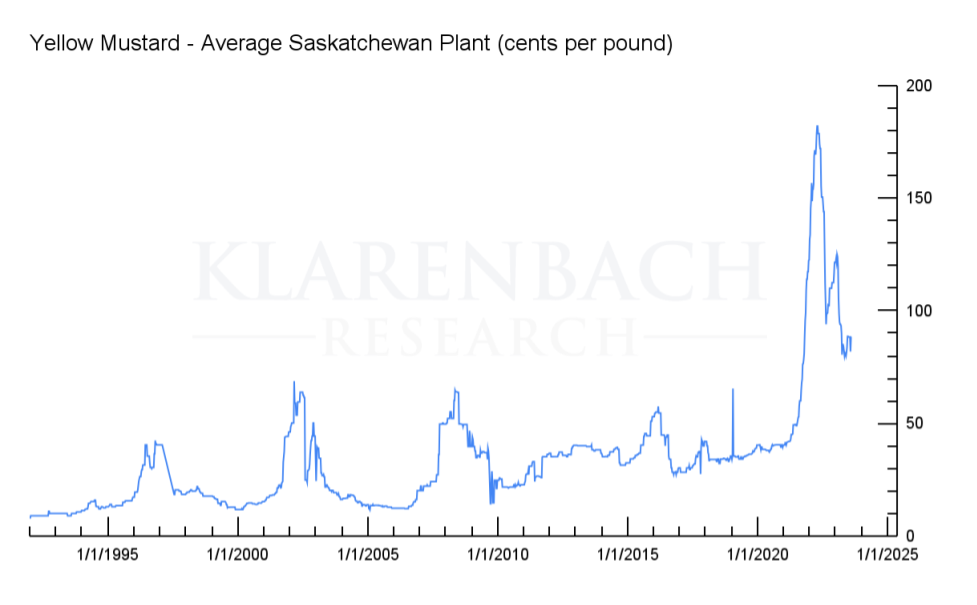
The first chart dates back to 1992.
One can see the wild ride of the past three years.
Hopefully, you were one of the sellers near the top.
Let’s zoom in to look for clues of future price action in a shorter timeframe.
Keep reading with a 7-day free trial
Subscribe to Klarenbach Special Crops Report to keep reading this post and get 7 days of free access to the full post archives.